
Coronavirus: COVID Deaths In U.S. By Age, Race
U.S. Coronavirus Deaths by Age
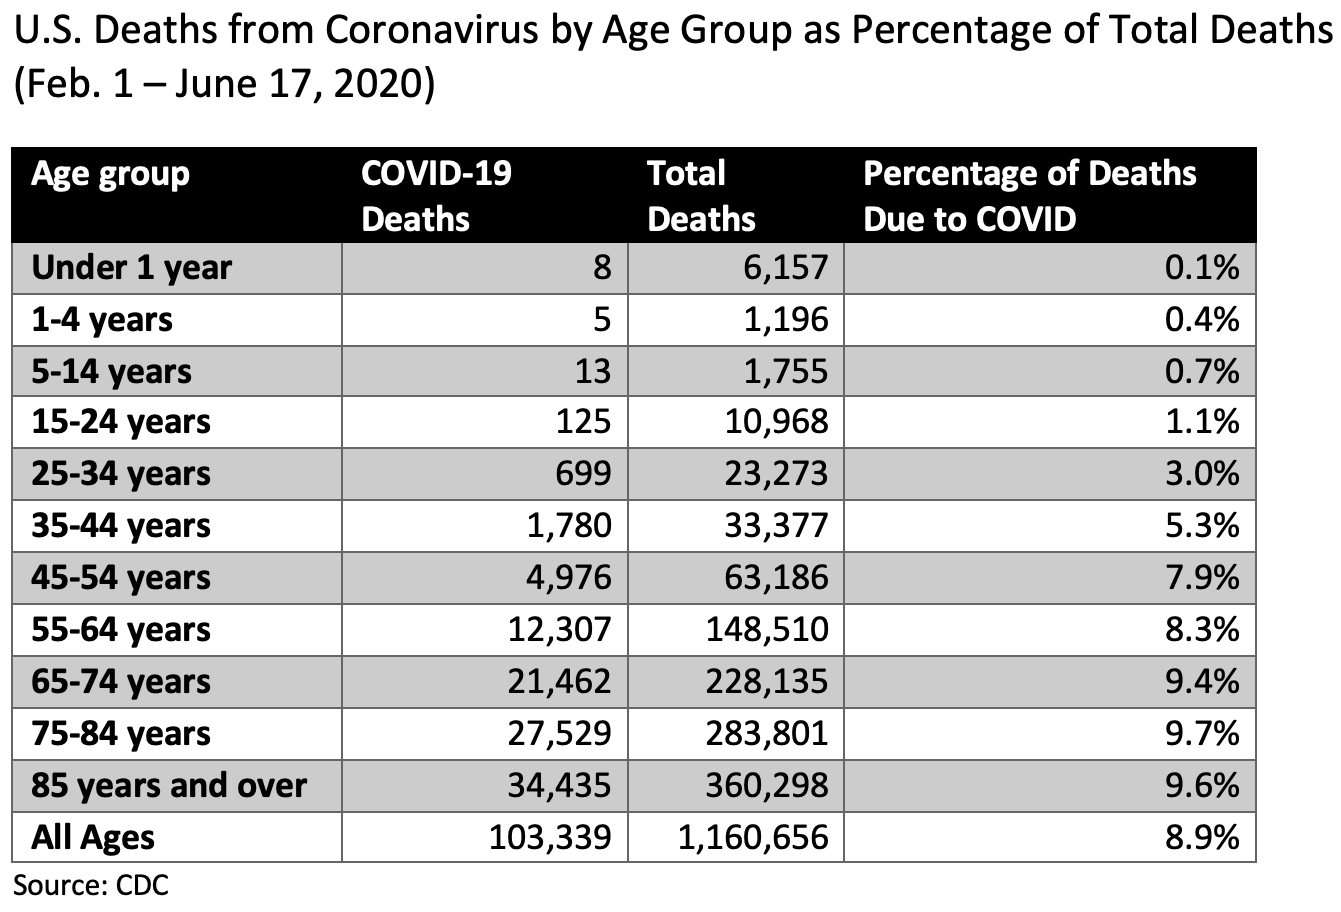
Here’s the coronavirus mortality data by age group:

As shown, deaths in young people (from babies to college students) are almost non-existent. The first age group to provide a substantial contribution to the death toll is 45-54 years, who contribute nearly 5% of all coronavirus deaths. More than 80% of deaths occur in people aged 65 and over. That increases to over 92% if the 55-64 age group is included.
One thing that is often forgotten is that people of all ages are dying all the time. Each year, about 2.8 million Americans pass away. The following chart shows the percentage of deaths in each age group that were due to coronavirus:
U.S. Coronavirus Deaths by Race
The following chart depicts U.S. coronavirus deaths by race.
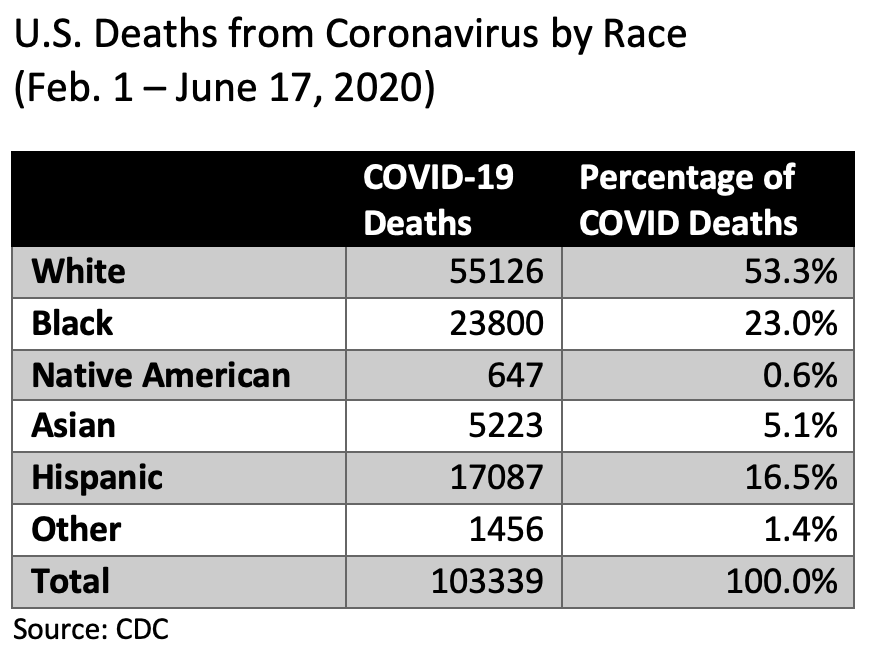
The number that stands out here is the percentage of COVID deaths that occurred among Black Americans. Blacks constitute about 13% of the U.S. population but suffered 23% of all COVID deaths.
Risk of Death from Coronavirus: COVID-19 Infection Fatality Rate (IFR)
None of the above data answers the question, “What is my risk of dying from coronavirus if I get infected?” For that, we need to look at the infection fatality rate (IFR), which is the percentage of people who die given that they are infected.
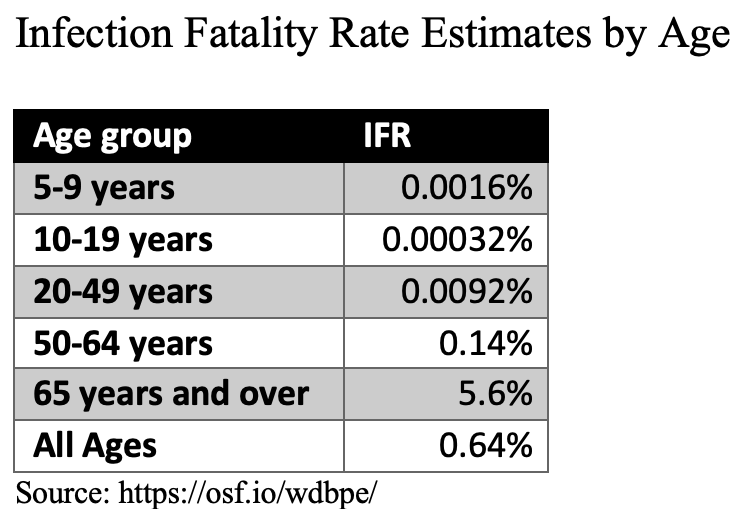
While coronavirus is obviously concerning and a very real threat to some people (namely, the elderly and immuno-compromised), these data also show that the risk for the rest of the population is quite low.
CDC Data Sources (Accessed on 23-June-2020)